Accuracy Explained for Industrial AI
Formula Notes / AI Model Evaluation
Accuracy is the most familiar classification metric. It answers a simple question: what percentage of all predictions were correct? Because it is easy to calculate and explain, it is often the first number shown in an AI model report.
In industrial AI, however, the most important events are often rare. Most products are good, most machines are operating normally, and most orders are delivered on time. A model can achieve a high accuracy score by predicting the common outcome almost every time while failing to detect the rare event that matters.
Accuracy is therefore useful but incomplete. It should be interpreted together with class balance, confusion-matrix counts, precision, recall, and the operational cost of each error.
| QUICK ANSWER: Accuracy measures overall correctness. It is most informative when classes are reasonably balanced and error costs are similar. When defects or failures are rare, high accuracy can hide zero detection capability. |
1. Why Accuracy Matters
Accuracy provides a broad summary of model performance. It combines correct positive and correct negative predictions into one proportion. For stakeholders who need an initial overview, it is easy to understand and compare.
The metric can be appropriate when the positive and negative classes occur at similar rates, the cost of false positives and false negatives is comparable, and the evaluation data represent real future operation. Under those conditions, overall correctness may align reasonably well with operational value.
The problem begins when these assumptions fail. In manufacturing, class imbalance is common and error costs are rarely equal. Missing one critical defect may matter more than correctly passing hundreds of routine good units.
| MANAGERIAL MEANING: Accuracy tells how often the model was correct overall. It does not tell whether the model caught the rare event, whether alerts were trustworthy, or whether the result was useful. |
2. The Industrial Problem
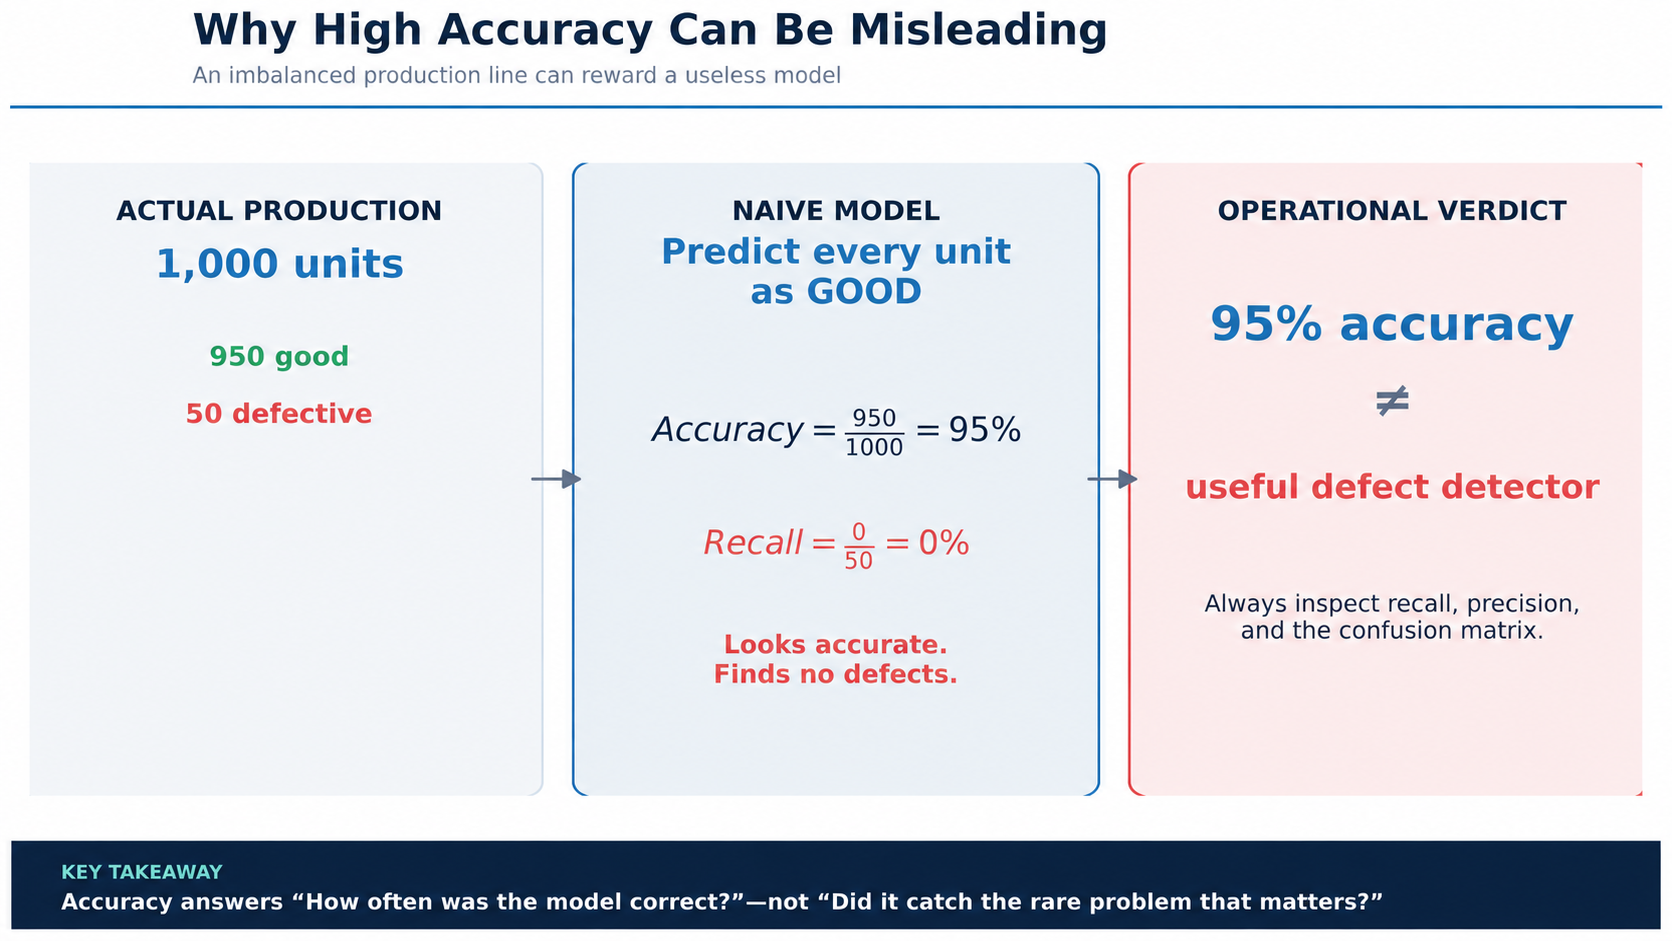
Suppose a factory produces 1,000 units. Nine hundred fifty are good and 50 are defective. A model that predicts every unit as good will make 950 correct predictions and only 50 incorrect predictions.
Its accuracy is 95%. That score sounds strong, yet the model detects none of the 50 defects. It has no practical value as a defect detector. The high score comes entirely from the dominance of good units in the dataset.
The same issue appears in predictive maintenance. If a machine fails on only 1% of operating days, a model that always predicts “no failure” achieves 99% accuracy. It provides no early warning.
3. The Formula
Accuracy is calculated from the confusion matrix:

The numerator contains all correct predictions. The denominator contains all evaluated predictions. Accuracy therefore weights every observation equally, regardless of class, consequence, or response cost.
That equal weighting is the reason accuracy is easy to understand—and the reason it can be misleading in an imbalanced or high-consequence problem.
4. What Each Symbol Means
Table 1. Symbols in the accuracy formula.
| Symbol | Meaning |
| TP | True positives: real positive cases correctly detected. |
| TN | True negatives: real negative cases correctly identified. |
| FP | False positives: negative cases incorrectly flagged as positive. |
| FN | False negatives: positive cases incorrectly missed. |
| Total | TP + TN + FP + FN, the number of evaluated cases. |
The meaning of positive must be defined by the project. In defect detection, positive usually means defective. In on-time delivery prediction, positive may mean delayed. The interpretation of accuracy changes if the class definition changes.
5. A Simple Manufacturing Example
The imbalance trap can be seen directly in the 1,000-unit example:
Table 2. Two models with similar accuracy but very different usefulness.
| Model | TP | TN | FP | FN | Accuracy | Recall |
| Always predict good | 0 | 950 | 0 | 50 | 95.0% | 0.0% |
| Useful detector | 40 | 920 | 30 | 10 | 96.0% | 80.0% |
The useful detector has only one percentage point more accuracy than the naive model, but it catches 40 of 50 defects. The improvement that matters is visible in recall and the confusion matrix, not in accuracy alone.

Figure 1. A model can achieve 95% accuracy while detecting no defects.
6. How AI Agents Use Accuracy
An AI agent can still use accuracy as one part of a broader evaluation stack. It may track accuracy to detect a general performance shift while separately monitoring precision, recall, false-alarm volume, missed-event rate, and business consequences.
- Report accuracy together with the full confusion matrix.
- Compare accuracy by product, machine, supplier, shift, and risk segment.
- Monitor whether changing class prevalence is artificially raising or lowering the score.
- Use time-based validation so evaluation reflects future operation rather than a random historical mix.
- Connect metric changes to review workload, escaped defects, downtime, and execution outcomes.
- Prevent automated deployment when accuracy is high but critical-class recall is below tolerance.
The agent should explain why the score changed. A higher accuracy value may reflect genuine improvement, or it may simply reflect fewer defects in the evaluation period.
7. When Accuracy Is Appropriate
Accuracy is more informative when classes are reasonably balanced, labels are reliable, the cost of errors is similar, and the decision threshold is fixed for a stable operating purpose. Examples may include classification among equally frequent process states or a controlled benchmark where every class matters similarly.
Even in these cases, accuracy should not be the only metric. Segment performance, probability calibration, robustness, latency, and operational execution may still determine whether the system is acceptable.
| USE ACCURACY WITH CONFIDENCE WHEN: The class distribution is known, representative, and not extremely imbalanced; the consequences of FP and FN are comparable; and the confusion matrix confirms that the model is not ignoring an important class. |
8. Evaluate the Model as a Metric Family
Professional evaluation selects a family of metrics that matches the task and consequence. Accuracy summarizes overall correctness. Precision measures the credibility of positive alerts. Recall measures coverage of real positive cases. F1 provides one balance between precision and recall. Specificity measures the ability to identify negatives. PR-AUC is often useful for rare-event ranking, while calibration measures the quality of predicted probabilities.

Figure 2. Accuracy should be evaluated as part of a metric family.
The metric family should then be connected to non-model measures: time to detect, false alarms per shift, human acceptance, override rate, execution success, downtime avoided, yield impact, and auditability. A model can be statistically strong but operationally weak if the surrounding workflow fails.
A useful evaluation also includes a baseline. The model should be compared with the current manual process, a simple rule, and a naive majority-class prediction. Beating a weak benchmark may not justify deployment; the model should improve the decision outcome that the organization cares about.
Metric aggregation can also hide instability. A 96% overall accuracy may combine 99% on a high-volume product and 70% on a low-volume but high-value product. Weighted averages should be accompanied by segment results so the system does not systematically underperform on a critical group.
After deployment, accuracy should be tracked with data drift, label delay, and action completion. A score based on unresolved cases may look better than reality. The evaluation window should close only when the final outcome is known and linked back to the original prediction.
9. Key Takeaway
| KEY TAKEAWAY: Accuracy is a useful overview of overall correctness, but it can be dangerously reassuring when defects, failures, or delays are rare. Always inspect class balance, the confusion matrix, precision, recall, and operational consequences before judging an industrial AI model. |
The simplest reminder is: high accuracy may describe the dataset better than it describes the model’s ability to find the problem.
| Series note: Use this article with the neighboring Formula Notes to build internal links across statistics, model evaluation, and industrial AI-agent decision making. |
Leave a Reply